
What is Price Elasticity?

Written by Arnon Shimoni
✓ Expert
Last updated on:
Price elasticity of demand measures how much quantity demanded changes in response to a change in price. It's calculated as the percentage change in quantity divided by the percentage change in price, and it's the quantitative expression of price sensitivity. Demand is elastic when the absolute value exceeds 1 (quantity moves more than price), inelastic when it's below 1, and unit elastic at exactly 1, where revenue is maximised.
Field | Detail |
|---|---|
Also known as | PED, own-price elasticity, demand elasticity |
Formula | % change in quantity demanded ÷ % change in price |
Sign | Normally negative, since price and quantity move in opposite directions. Usually quoted as an absolute value |
Elastic | |ε| > 1. Quantity moves proportionally more than price |
Inelastic | |ε| < 1. Quantity moves proportionally less than price |
Unit elastic | |ε| = 1. Revenue is at its maximum |
Related measures | Cross-price elasticity, income elasticity, advertising elasticity |
Data sources | Historical billing data, price tests, Gabor-Granger studies |
Key limitation | Only observable across prices you've actually charged |
The formula, and the version you should actually use
The simplified formula looks like this:
ε = (% change in quantity demanded) / (% change in price)
For example, if you raise price 10% and lose 15% of volume, the elasticity is -1.5. Demand is elastic.
The problem with the simple version is that it gives a different answer depending on which direction you compute it. Going from €100 to €120 is a 20% increase; coming back from €120 to €100 is a 16.7% decrease. Same two points, two different elasticities.
The midpoint (arc) formula fixes this by dividing changes by the average of the two values rather than the starting value:
ε = [(Q₂ - Q₁) / ((Q₁ + Q₂)/2)] / [(P₂ - P₁) / ((P₁ + P₂)/2)]
Use the midpoint version for any discrete price change, which in practice is all of them. Point elasticity (the calculus version, using the derivative at a single price) is the right tool when you have a fitted demand function rather than two observed points.
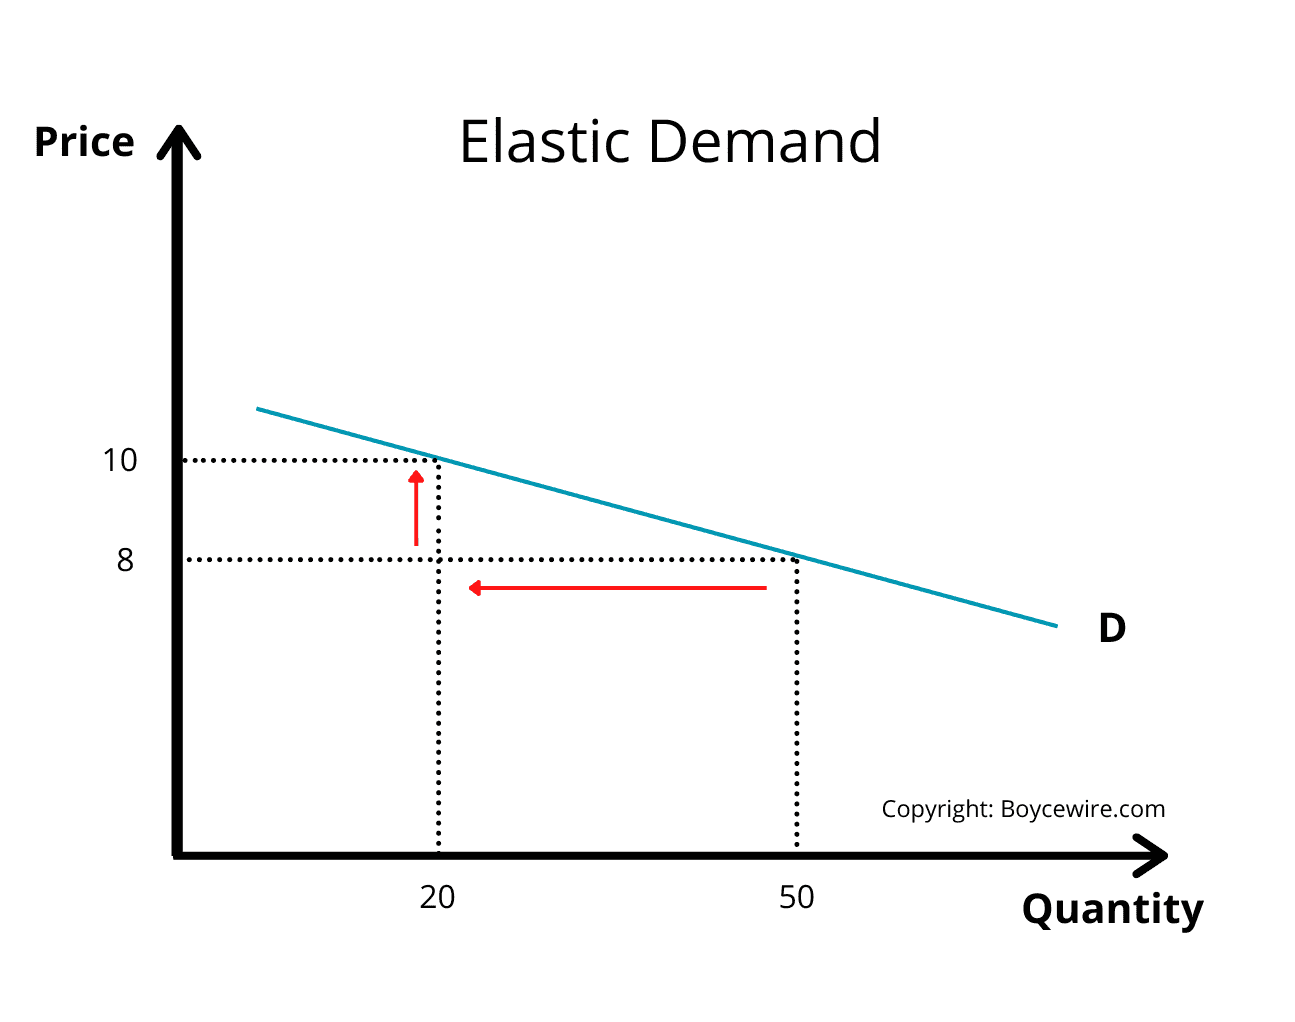
Elasticity is not a constant. It's a property of a point on a demand curve, and it changes as you move along it. "Our elasticity is -1.3" is shorthand for "at roughly the prices we've charged, in roughly the segments we've sold to, recently." Every one of those qualifiers matters.
Elastic, inelastic, and what to do about it
Elasticity | Meaning | Raising price does what to revenue? | Typical of |
|---|---|---|---|
| Quantity moves more than price | Decreases it | Many substitutes, discretionary, price-transparent categories |
| Proportional | No change. Revenue is at its peak | The point you're looking for, if revenue is the goal |
| Quantity moves less than price | Increases it | Few substitutes, mission-critical, high switching cost |
| Quantity doesn't move | Increases it proportionally | Effectively nothing, in practice |
The revenue rule: raise price when demand is inelastic, cut it when demand is elastic, and revenue peaks at unit elasticity.
Note the word revenue. Profit peaks somewhere else, and for anything with real marginal cost the profit-maximising price sits above the revenue-maximising one. For AI products with meaningful inference cost, that difference is large enough to change the decision. If you're optimising a price, plot the contribution curve, not just the revenue curve. See marginal cost pricing and contribution margin based pricing.
What makes demand elastic
The determinants map closely onto the nine effects driving price sensitivity:
Substitutes. More alternatives, more elasticity. This is the single biggest driver.
Necessity. Mission-critical infrastructure is inelastic. A nice-to-have analytics add-on is not.
Budget share. A large line item attracts scrutiny and a committee. A small one gets approved.
Time horizon. Demand is more elastic in the long run, because switching takes time. A price increase that produces no immediate churn can still show up as higher churn three renewal cycles later, which is why measuring elasticity over a short window flatters you.
Who pays. Shared or pass-through costs dampen elasticity considerably.
Switching cost. High switching costs make existing customers inelastic and new prospects elastic. The same price change lands differently on the two groups, which is the underlying argument for grandfathering.
Calculating elasticity from your own billing data
Survey-derived elasticity is a guess. Your billing system holds the real thing, if you've ever charged more than one price, which you have (list price plus a discount distribution is a natural price experiment you've been running without meaning to).
Source 1: your discount distribution. Group closed-won and closed-lost deals by effective price band and compute win rate per band. The slope of win rate against effective price is an elasticity estimate. It's contaminated (bigger discounts go to bigger, harder deals) and it's free and directionally right.
Source 2: past price changes. For each historical change, compare new-customer acquisition rate, expansion rate, and churn before and after, controlling as best you can for seasonality and whatever else you changed that quarter. Watch the window: 30-day effects understate churn response badly.
Source 3: cross-plan behaviour. In tiered pricing, the distribution of customers across tiers and the rate of upgrades and downgrades encodes elasticity at each tier boundary. A tier nobody upgrades into is priced past the elastic point.
Source 4: usage response to rate changes. For consumption products, this one is unique and underused. When you change a per-unit rate, you can observe whether customers changed their consumption, separately from whether they churned. That's a direct elasticity measurement on the actual metered unit, at customer-level granularity, in your own usage metering data.
Two cautions. Watch retention, not just conversion: elasticity measured on acquisition alone will tell you to cut the price, every time, because the customers a lower price attracts churn later and outside your window. And segment before you compute: a blended elasticity across SMB and enterprise describes a customer who doesn't exist.
Cross-price and other elasticities
Cross-price elasticity measures how demand for your product responds to a change in the price of another. Positive means substitutes (their price rises, your demand rises). Negative means complements (their price rises, your demand falls). In software this is how you find out whether that adjacent vendor is really a competitor: if their price cut doesn't move your demand, they aren't.
Income elasticity measures response to changes in buyer income or budget. The B2B analogue is budget cycles and macro conditions, and it's why the same price faces different resistance in an expansion year than in a cost-cutting one.
Advertising and quality elasticity measure response to non-price variables. Worth knowing they exist, mostly to remember that price is one lever among several and rarely the cheapest one to pull.
Where elasticity breaks in SaaS and usage-based pricing
The concept came from markets with repeated, independent purchases of a unit good. Recurring software violates several of its assumptions.
"Quantity" is ambiguous. Is it customers, seats, units consumed, or contract value? Each gives a different elasticity, and they point in different directions. Raising a per-unit rate might reduce units consumed while raising revenue per account and leaving customer count untouched. Which number is your quantity? You have to decide before the calculation means anything.
The purchase is a subscription, so the response is delayed. A price change hits new customers immediately and existing ones only at renewal. Your elasticity measurement is really two different elasticities on two different clocks, and blending them hides both.
Consumption elasticity is separate from purchase elasticity. This is the interesting one, and it's specific to usage-based models. Customers respond to a rate change in two ways: some leave, and some stay and use less. The second effect is invisible in a seat-based world and it's substantial in a consumption world. Both belong in your model, and only your metering data can see the second one.
Price is bundled with packaging. Very few price changes are pure. You raise the price and also move a feature between tiers, or change the included allowance. The elasticity you measure is for the whole change, not for the price.
Costs move underneath. For AI products, an elasticity estimate from a year ago was measured against a cost base that has since changed, in a market whose reference prices have moved. Old elasticity estimates in this category age faster than most.
None of this makes elasticity useless. It makes it a number that needs its qualifiers attached: which quantity, which segment, which time window, which price range. An elasticity quoted without those is a decoration.
Related terms
Frequently asked questions
What is price elasticity of demand?
A measure of how much quantity demanded changes when price changes, calculated as the percentage change in quantity divided by the percentage change in price. It's the numerical version of price sensitivity.
How do you calculate price elasticity?
Divide the percentage change in quantity by the percentage change in price. For any real price change, use the midpoint (arc) formula, which divides each change by the average of the two values so you get the same answer in both directions.
What does an elasticity of -1.5 mean?
A 1% price increase reduces quantity demanded by 1.5%. Demand is elastic, so raising price reduces total revenue and cutting price increases it.
What's the difference between elastic and inelastic demand?
Elastic means quantity responds more than proportionally to price (absolute elasticity above 1). Inelastic means it responds less than proportionally (below 1). Elastic demand punishes price increases; inelastic demand rewards them.
Why is price elasticity usually negative?
Because price and quantity normally move in opposite directions. Most practitioners quote the absolute value and drop the sign, since the direction is assumed.
What is unit elasticity?
Where the absolute elasticity equals 1 and quantity changes exactly in proportion to price. Total revenue is at its maximum at this point. Profit is maximised at a higher price whenever marginal cost is above zero.
How do I measure elasticity for my SaaS product?
From your own data: win rates by effective price band, before-and-after analysis of past price changes, upgrade and downgrade rates at tier boundaries, and, for usage products, how consumption itself responded to rate changes. Segment before you calculate, and measure over a window long enough to capture churn.
What's the difference between price elasticity and price sensitivity?
Sensitivity is the concept and its drivers; elasticity is the measurement expressed as a number. You reason with sensitivity and model with elasticity.
What is cross-price elasticity?
How your demand responds to a change in another product's price. Positive means the two are substitutes, negative means they're complements. It's a useful test of whether a supposed competitor actually competes with you.
Is elasticity constant across all prices?
No. It's a property of a point on the demand curve and changes as you move along it. An elasticity estimate is only valid near the prices you measured it at.
Does elasticity apply to usage-based pricing?
Yes, with an extra dimension. Customers respond to a rate change by leaving and by consuming less. Those are two distinct elasticities, and both matter. Metering data lets you see the second one, which seat-based businesses never could.
Why does short-run elasticity differ from long-run?
Switching takes time. A price increase may produce no immediate churn while quietly raising churn at renewals two or three cycles out. Measuring over a short window systematically understates the true response.
Educational reference. The best elasticity data most companies own is sitting in their billing system, unqueried. Solvimon keeps metering, rating, and invoicing in one ledger, so consumption response and revenue response are readable from the same data. See pricing methodology.
Ready for billing v2?
Solvimon is monetization infrastructure for companies that have outgrown billing v1. One system, entire lifecycle, built by the team that did this at Adyen.