
What is Net Revenue Retention (NRR)?

Written by Arnon Shimoni
✓ Expert
Last updated on:
Net revenue retention (NRR) tells you whether your existing customer base is growing or shrinking in revenue terms, independent of new sales. A company with 120% NRR can grow without signing a single new customer. A company at 80% NRR is in a leaky bucket: no matter how fast sales fills it, the bottom drains faster. For investors evaluating SaaS and usage-based businesses, NRR is often the first number they look at after ARR.
How NRR Is Calculated
The standard formula:
NRR = (Starting MRR + Expansion MRR - Contraction MRR - Churned MRR) / Starting MRR × 100
Applied over a cohort of customers from a fixed start date (typically a month or a year ago):
Starting MRR: Revenue from the cohort at the beginning of the period
Expansion MRR: Additional revenue from upsells, seat additions, usage growth, or plan upgrades
Contraction MRR: Revenue lost from downgrades or reduced usage within the same accounts
Churned MRR: Revenue lost from full cancellations
New customers are excluded entirely. NRR only measures what happened with customers who existed at the start of the period.
Gross Revenue Retention vs. Net Revenue Retention
These two metrics get confused regularly. The difference matters.
Gross Revenue Retention (GRR) excludes expansion. It only measures contraction and churn:
GRR = (Starting MRR - Contraction MRR - Churned MRR) / Starting MRR × 100
GRR can never exceed 100% because it doesn't include upsell. It measures your floor — how well you hold onto what you already have.
NRR includes expansion and can exceed 100%, which is the point. When NRR is above 100%, expansion from existing customers more than compensates for churn and downgrades.
Metric | Includes Expansion | Can Exceed 100% | Measures |
|---|---|---|---|
GRR | No | No | Revenue retention floor |
NRR | Yes | Yes | Net revenue trajectory from existing base |
Both numbers matter. High NRR with low GRR means you're growing existing accounts but churning others — a pattern that's fragile because it depends on a shrinking set of expanding accounts. High GRR with low NRR means you retain customers but can't grow them.
Logo Retention vs. Dollar Retention
Logo retention (also called customer retention rate) counts the percentage of customers who stayed, regardless of how much they spend. A company that keeps 95% of customers has 95% logo retention.
Dollar retention is what NRR measures: not how many customers stayed, but how much revenue stayed and grew.
A company can have 90% logo retention and 115% NRR simultaneously if the 10% that churned were small accounts and the 90% that stayed expanded significantly. Conversely, 99% logo retention with 85% NRR means the customers who churned were disproportionately large. Logo retention is a vanity metric for usage-based and AI companies; dollar retention is what drives valuation.
NRR by Business Model and ARR Band
Benchmarks vary by business model. Usage-based companies can achieve higher NRR than pure subscription businesses because expansion happens automatically as customers use more — no sales motion required. AI-native companies often see extreme NRR variance, both high and low, because usage is less predictable than seat counts.
Business Model | Strong NRR | Median NRR | Weak NRR |
|---|---|---|---|
Pure SaaS (seat-based) | >120% | 100–110% | <90% |
Usage-based / consumption | >130% | 110–120% | <95% |
AI/API (token-based) | >140% | 110–125% | <85% |
Enterprise SaaS | >115% | 105–115% | <95% |
SMB-focused SaaS | >105% | 90–100% | <80% |
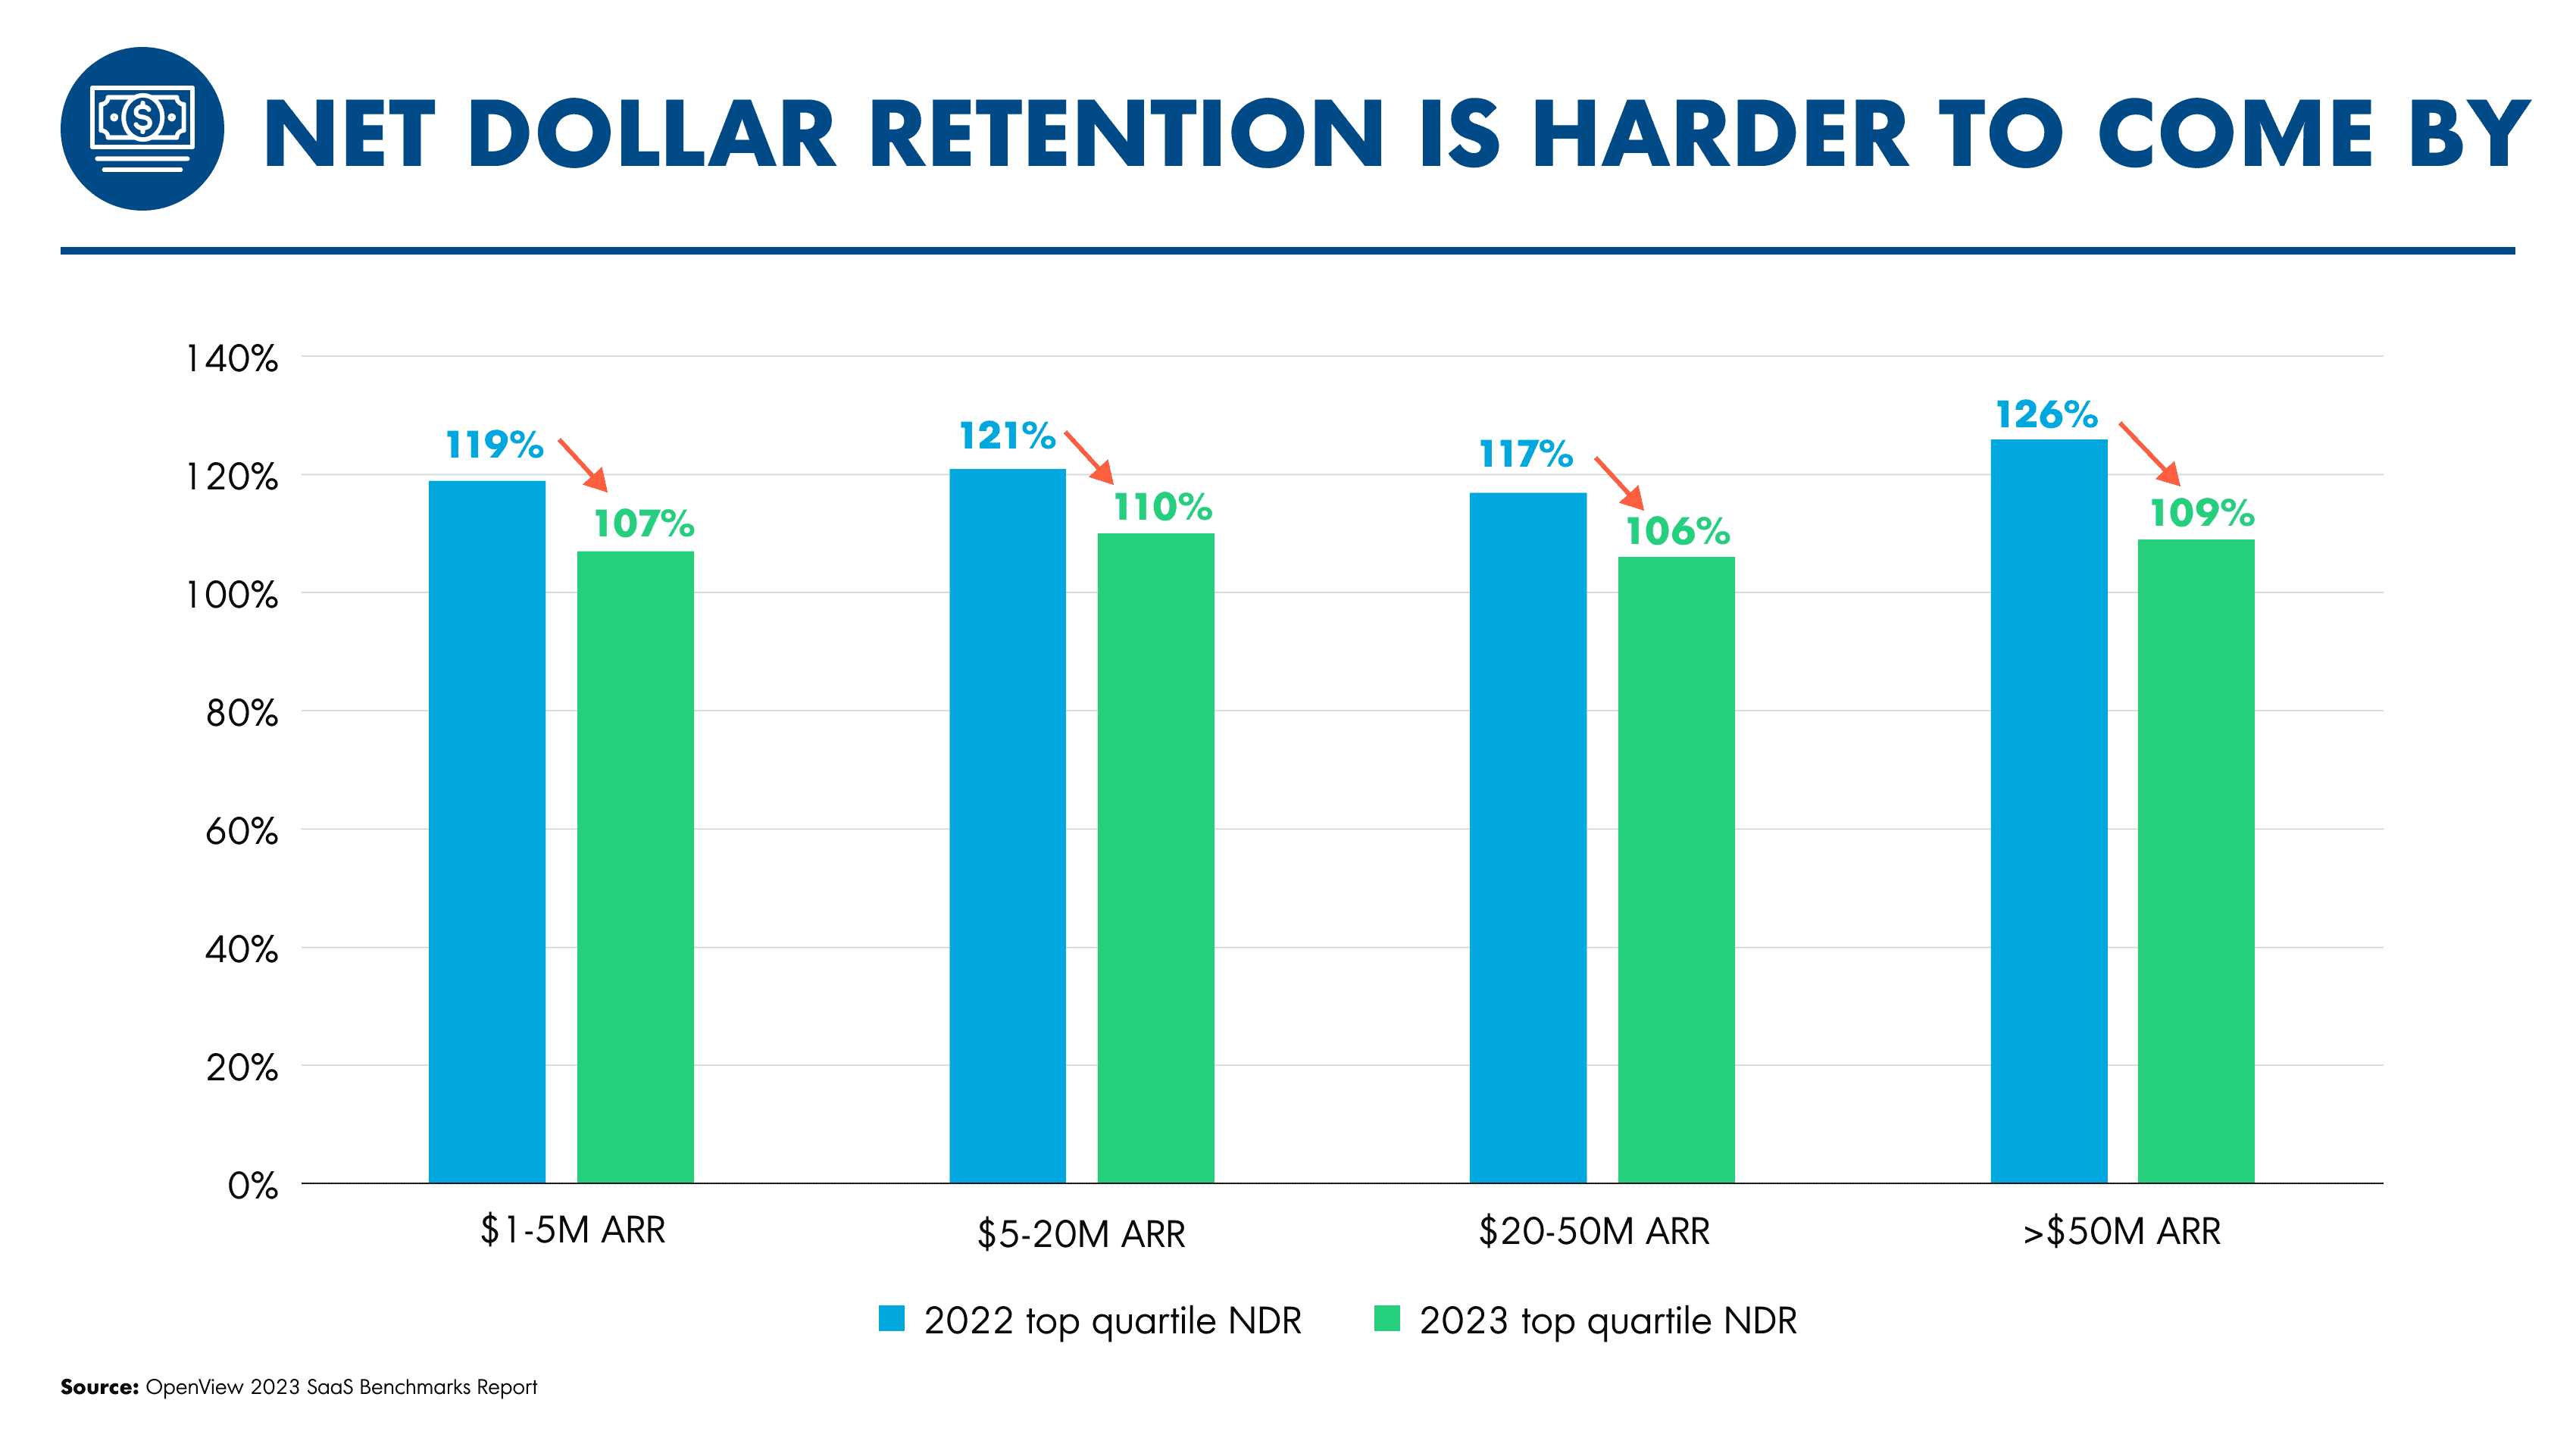
ARR band also shifts the benchmark. Earlier-stage companies (under $10M ARR) often report higher NRR because a single expanding customer moves the number significantly. At scale ($100M+ ARR), consistently hitting 120%+ NRR is genuinely exceptional.
Note: Benchmarks from OpenView, KeyBanc, and SaaS Capital surveys, 2023–2024.
NRR in the AI Era
Usage-based billing and AI products change the NRR calculation in two ways.
Expansion happens without a sales motion. For seat-based SaaS, expansion requires a renewal conversation or an upsell. For usage-based and AI products, customers who use the product more automatically generate more revenue. This compresses expansion cycles and makes NRR a leading indicator of product stickiness rather than a lagging indicator of sales effectiveness.
But churn is faster too. A customer on a seat license takes time to wind down. A customer consuming API calls or credits can simply stop sending requests. The granularity of usage-based billing means NRR can shift within a single month in ways that annual contract SaaS can't. Monthly NRR reporting is essential for AI-native companies; quarterly reporting hides too much.
NRR can mask cost-side problems. A company with 130% NRR that's also selling compute at thin margins isn't necessarily healthy. If your cost-per-unit doesn't compress as customers expand, high NRR with poor margin management is a growth trap. Volume growth without margin improvement is common in early AI businesses and shows up eventually in unit economics, not in NRR.
NRR vs. NDR
Net Dollar Retention (NDR) is the same metric with a different name. Some investors and reports use NDR, others use NRR. The formula is identical. If you see both in the same document, verify they're using the same cohort definition and timeframe — sometimes companies calculate them slightly differently.
Common Challenges
Cohort definition inconsistency. NRR calculated over a 12-month cohort looks different from NRR calculated over a rolling 3-month window. Neither is wrong, but comparing your NRR to a benchmark without knowing which timeframe the benchmark uses is meaningless. Most public SaaS companies report trailing-twelve-month NRR on a quarterly basis.
Multi-year contracts distort the number. If customers sign two-year deals with step-up pricing built in, year two shows as expansion even if the customer didn't actually grow usage. NRR looks strong, but it's contracted expansion rather than organic. Investors who dig into the cohorts will find this.
Expansion credit attribution is messy. When a customer in an account upgrades, is that expansion counted in NRR from the original contract start date, or from the expansion date? When a single account has multiple contracts (common in enterprise multi-entity setups), which contract's cohort captures the expansion? These definitions need to be locked in your billing system, not calculated in a spreadsheet after the fact. See multi-entity billing for where this gets complicated.
Churn lag obscures real retention. Customers who are disengaged but still paying appear in NRR as retained. The number looks healthy until they cancel in a single month. Leading indicators like usage trends and login frequency catch this before NRR does; NRR is a lagging measure.
FAQ
Q: What's a good NRR for a seed-stage startup?
At seed, NRR is often not meaningful because the customer base is too small and cohorts are too short. A single churned customer can drop NRR by 20 points. Focus on GRR (are you keeping customers?) and expansion signals (are any customers spending more?) rather than the NRR headline number until you have at least 20–30 customers in a cohort.
Q: Should NRR include new logo revenue?
No. By definition, NRR excludes new customers. If your calculation includes revenue from customers who signed up during the measurement period, you're calculating blended retention, not NRR. Keep the cohort fixed at the start date.
Q: How do free-trial conversions affect NRR?
Conversions from free to paid are new customer revenue, not expansion. They shouldn't be counted in NRR until the customer has been paying long enough to be included in a historical cohort. This matters for PLG companies that report NRR — free-to-paid conversion and actual retention are separate motions that should be tracked separately.
Q: Why do investors care more about NRR than churn rate?
Churn rate measures logo loss. NRR measures revenue trajectory. A company can have 15% annual churn (bad-sounding) but 130% NRR (excellent) if the customers who stay are expanding fast. Revenue efficiency matters more than headcount retention at scale.
Q: How does NRR relate to ARR forecasting?
NRR is a direct input to revenue forecasting. If your current ARR is $10M and your trailing NRR is 120%, you'd expect approximately $12M from your existing base in 12 months before adding any new logos. That baseline makes new logo targets more honest: you need new ARR to cover the delta between your growth target and what NRR already delivers.
Ready for billing v2?
Solvimon is monetization infrastructure for companies that have outgrown billing v1. One system, entire lifecycle, built by the team that did this at Adyen.
Price Benchmarking
AI Token Pricing
Freemium Model
Market Based Pricing
Odd-Even Pricing
Price Estimation
Marginal Cost Pricing
Quote to Cash
Revenue Assurance
ASC 606
Revenue Recognition
ACH
Subscription pause
Entitlements
France's E-Invoicing reform
E-invoicing
Net Revenue Retention: How to Calculate It and What It Actually
Volume Commitments
IFRS 15
Prepaid vs Postpaid billing
PLG billing
Captive Product
Headless Monetization
Seat-based Pricing
Usage-based Pricing
Invoice
MRR & ARR
Subscription Management
Recurring Payments
Cost Plus Pricing
Dunning
Payment Gateway
Value Based Pricing
Revenue Backlog
Deferrred Revenue
Consolidated Billing
Pricing Engine
Embedded Finance
Overage Charges
Flat Rate Pricing
Minimum Commit
Yield Optimization
Grandfathering
Billing Engine
Predictive Pricing
Metering
AI Agent Pricing
AI-Led Growth
AISP
Advance Billing
Credit-based pricing
Outcome Based Pricing
Top Tiered Pricing
Region Based Pricing
High-Low Pricing
Lifecycle Pricing
Pay What You Want Pricing
Time Based Pricing
Contribution Margin-Based Pricing
Decoy Pricing
Dual Pricing
Loss Leader Pricing
Omnichannel Pricing
Revenue Optimization
Sales Enablement
Sales Optimization
Volume Discounts
Margin Management
Sales Prediction Analysis
Pricing Analytics
Intelligent Pricing
Margin Pricing
Price Configuration
Customer Profitability
Discount Management
Dynamic Pricing Optimization
Enterprise Resource Planning (ERP)
Guided Sales
Margin Leakage
Usage Metering
Smart Metering
Quoting
CPQ
Self Billing
Revenue Forecasting
Revenue Analytics
Total Contract Value
Pricing Bundles
Penetration Pricing
Dynamic Pricing
Price Elasticity
Feature-Based Pricing
Transaction Monitoring
Minimum Invoice
Tiered Pricing
SaaS Billing
Billing Cycle
Payment Processing
Hybrid Pricing Models
Stairstep Pricing
Multi-currency Billing
Multi-entity Billing
Ramp Up Periods
Proration
Sticky Stairstep Pricing
Tiered Usage-based Pricing
Revenue Leakage
PISP
PSP


Why Solvimon
Helping businesses reach the next level
The Solvimon platform is extremely flexible allowing us to bill the most tailored enterprise deals automatically.
Ciaran O'Kane
Head of Finance
Solvimon is not only building the most flexible billing platform in the space but also a truly global platform.
Juan Pablo Ortega
CEO
I was skeptical if there was any solution out there that could relieve the team from an eternity of manual billing. Solvimon impressed me with their flexibility and user-friendliness.
János Mátyásfalvi
CFO
Working with Solvimon is a different experience than working with other vendors. Not only because of the product they offer, but also because of their very senior team that knows what they are talking about.
Steven Burgemeister
Product Lead, Billing