
What is the Gabor-Granger Method?

Written by Arnon Shimoni
✓ Expert
Last updated on:
The Gabor-Granger method is a pricing research technique that shows a respondent a series of specific prices for a product and records purchase intent at each one. The resulting data produces a demand curve (share willing to buy at each price) and, multiplied by price, a revenue curve that identifies the revenue-maximising price. André Gabor and Clive Granger developed it at the University of Nottingham in the early 1960s, publishing the underlying work in Applied Statistics in 1961. Granger later won the 2003 Nobel Memorial Prize in Economics, for time series econometrics rather than for this.
Field | Detail |
|---|---|
Also known as | Gabor-Granger price test, monadic price ladder, price laddering |
Developed by | André Gabor and Clive W. J. Granger, University of Nottingham, 1961-1965 |
Question format | Purchase intent at 5 or more explicit price points, presented iteratively |
Output | Demand curve, revenue curve, revenue-maximising price |
Typical sample | 200-400 respondents per segment (practitioner convention) |
Best for | Established categories, single-price products, repricing decisions |
Weakest for | New categories, multi-dimensional pricing, feature and packaging questions |
Anchoring risk | High. The first price shown moves every answer after it |
Common companion method | Van Westendorp to set the range first |
How the method works
The mechanic is a ladder. You pick a set of candidate prices, show one, ask purchase intent, and move up or down depending on the answer.
Step 1. Pick the price points. Usually 5 to 7, spanning a range wide enough to include prices you'd never charge in either direction. If you have no idea where the range sits, run a Van Westendorp study first and use PMC-to-PME as your span.
Step 2. Present a price and ask intent. A 5-point purchase intent scale is standard: definitely would buy, probably would buy, might or might not, probably would not, definitely would not.
Step 3. Move up or down. If the respondent lands in the top two boxes (definitely or probably), show a higher price. If they don't, show a lower one. Keep going until you've found the highest price at which that respondent is still a top-two-box buyer.
Step 4. Randomise the starting point across respondents. This is the step people skip and it's the one that decides whether the study is worth anything. Anchoring on the first price is the method's defining weakness, and rotating the entry point across the sample spreads that bias instead of baking it in.
Step 5. Aggregate. For each price point, count the share of respondents who'd buy at that price or above. That's your demand curve. Multiply share by price at each point and you get a revenue curve, whose peak is the revenue-maximising price.
If you also know your marginal cost, multiply share by (price minus unit cost) and you get a contribution curve, whose peak is the profit-maximising price. That's usually a higher price than the revenue peak. For anything with meaningful cost of goods, which describes every AI product, this is the curve that matters and the one people forget to plot.
What the output looks like
Say you test €50, €100, €150, €200, €300 per month for a mid-market product:
Price | % who would buy | Indexed revenue | Indexed contribution (at €30 unit cost) |
|---|---|---|---|
€50 | 82% | 41 | 16 |
€100 | 64% | 64 | 45 |
€150 | 45% | 68 | 54 |
€200 | 28% | 56 | 48 |
€300 | 11% | 33 | 30 |
Revenue peaks at €150. Contribution also peaks at €150 here, but notice how much flatter the contribution curve is between €150 and €200: moving to €200 costs you 21% of revenue and only 11% of contribution. That gap is where the real pricing conversation happens, and it's invisible if you only plot revenue.
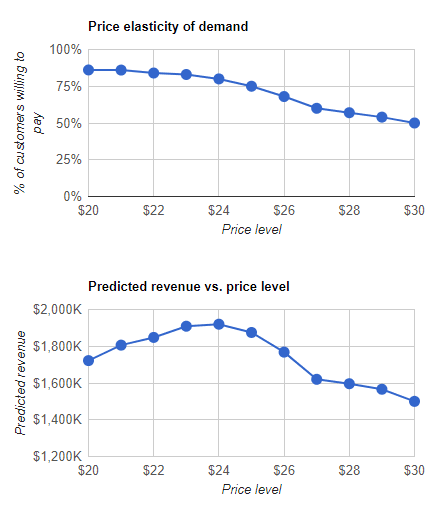
(Example output of Gabor-Granger test. By Happybunny95 - Own work, CC BY-SA 4.0, https://commons.wikimedia.org/w/index.php?curid=61825400)
The shape (steep intent decline, revenue peak somewhere in the middle third of the tested range) is the pattern you typically see.
Gabor-Granger vs Van Westendorp
The two get compared constantly, and they're not substitutes.
Gabor-Granger | Van Westendorp | |
|---|---|---|
Prices shown to respondent | Yes, explicitly | No, all open-ended |
Requires a reference price | Yes. Respondent needs category context | No. Works in brand-new categories |
Output | Demand curve, revenue curve, a specific price | A range, plus IPP and OPP reference points |
Anchoring risk | High | Low |
Answers "how much will we sell?" | Yes | Only with the NMS extension |
Answers "what's credible?" | No | Yes |
Best sequence position | Second | First |
The clean sequence: Van Westendorp to establish a credible range when you don't have one, Gabor-Granger inside that range to pick the level. Running Gabor-Granger alone in a category the respondent doesn't understand produces a demand curve that describes their confusion.
Where Gabor-Granger breaks
Anchoring. Showing a price creates one. Respondents shown €300 first and walked down accept higher prices than respondents shown €50 first and walked up. Randomising the start spreads it across the sample. It doesn't eliminate it.
Top-two-box inflation. "Probably would buy" is not buying. Survey purchase intent runs well above real conversion, and the gap varies by category, price level, and how enthusiastic your sample is. Practitioners commonly apply a discount factor to top-two-box scores. Picking that factor is judgment, and it's the single largest source of error in the final number.
It prices one thing. Gabor-Granger tests a price for a product. It can't tell you what a feature is worth, which features belong in which tier, or whether the price should differ by segment. Those are conjoint questions.
It ignores competitive response. The demand curve assumes the rest of the market stands still while you move. If your competitor matches within a quarter, the curve you measured describes a world that no longer exists.
No purchase context. The respondent isn't choosing between you and an alternative, they're evaluating you in isolation. Real buying decisions are comparative. Gabor, Granger and Sowter went after exactly this problem in 1970 by testing real versus hypothetical shop situations, and the concern has never fully gone away.
Gabor-Granger and usage-based pricing
The method's core assumption is one price and one purchase decision. Usage-based pricing doesn't offer that. The customer isn't accepting a price, they're accepting a rate card and then generating a bill.
Adapting it takes three moves:
Test the bill, not the rate. Present the price ladder as total monthly spend at a stated usage level: "for a team running 100,000 agent tasks a month, would you buy at €4,000?" Respondents can evaluate that. They cannot evaluate €0.04 per task, because they don't know how many tasks they run.
Ladder at multiple volumes. Run the same ladder at three or four volume assumptions. Each gives you a revenue-maximising monthly price, and the relationship between them tells you the shape of your tier structure and how steep your volume discounts should be.
Test the overage rate separately. In a hybrid model, the overage rate is a distinct decision that buyers react to distinctly, often more sharply than to the base fee, because overage feels like a penalty rather than a purchase. A separate ladder on the overage rate at a fixed base fee is worth running.
The remaining structural problem: Gabor-Granger optimises for a point on a curve, and consumption pricing means every customer sits at a different point. The answer you get is the best single rate for the average customer, and the average customer doesn't exist. Segment before you ladder, or you'll price for a fiction.
Related terms
Frequently asked questions
What is the Gabor-Granger method used for?
Finding the price that maximises revenue (or contribution) for a product, by measuring purchase intent at several explicit price points and building a demand curve from the results.
Who invented the Gabor-Granger method?
André Gabor and Clive Granger at the University of Nottingham, in work published from 1961 onward. Granger went on to share the 2003 Nobel Memorial Prize in Economics for unrelated work in time series econometrics.
How many price points should a Gabor-Granger study test?
Five to seven is standard, spanning a range wide enough that the extremes are prices you'd never actually charge. Too narrow a range and the revenue curve has no peak inside it.
What's the difference between Gabor-Granger and Van Westendorp?
Gabor-Granger shows prices and measures intent, producing a demand curve and a specific price. Van Westendorp asks open-ended questions with no prices shown, producing a credible range. Van Westendorp works without a reference price; Gabor-Granger needs one.
Does Gabor-Granger give a demand curve?
Yes. That's its main advantage over Van Westendorp. Share-willing-to-buy at each price point is a demand curve, and price times share is a revenue curve.
What is anchoring bias in Gabor-Granger?
The first price a respondent sees shifts every subsequent answer. Randomising the starting price across the sample spreads the bias rather than concentrating it, which is why it's a required design step rather than a nice-to-have.
Should I use the revenue curve or the contribution curve?
Contribution, if you know your unit cost. Revenue-maximising and profit-maximising prices differ, and for anything with significant cost of goods (AI inference, compute, payment processing) the difference is large enough to change the decision.
Is stated purchase intent reliable?
It's directionally useful and absolutely inflated. Top-two-box intent runs well above real conversion. Most practitioners apply a discount factor before acting on the number, and choosing that factor is the least scientific part of the whole exercise.
Can Gabor-Granger handle multiple pricing dimensions?
Poorly. It tests one price at a time. For a platform fee plus included volume plus overage rate, either run separate ladders per dimension or use conjoint analysis, which is designed for exactly this.
Does Gabor-Granger work for SaaS and AI products?
For a single subscription price, yes. For consumption pricing, only if you reframe the ladder around total monthly spend at a stated volume, and run it at several volumes to see the curve rather than a point.
How large a sample does Gabor-Granger need?
Convention is 200-400 per segment you want to read separately. The requirement grows with the number of price points, since each point needs enough responses to be stable.
What's the biggest mistake in a Gabor-Granger study?
Taking the revenue peak literally. It's the peak of a curve built from stated intent, in isolation from competitors, in a single segment, at one moment. It's an input to a decision, not the decision.
Educational reference. Solvimon holds rate cards, tiers, commits, and overage rules as configuration, so when a study says the price should move, moving it is a catalog change. See pricing methodology for how the methods fit together.
Sources: Gabor, A. and Granger, C.W.J., "On the Price Consciousness of Consumers," Applied Statistics (JRSS Series C) 10(3), 1961, pp. 170-188. Gabor, A., Granger, C.W.J. and Sowter, A.P., "Real and Hypothetical Shop Situations in Market Research," Journal of Marketing Research 7(3), 1970.
Ready for billing v2?
Solvimon is monetization infrastructure for companies that have outgrown billing v1. One system, entire lifecycle, built by the team that did this at Adyen.