Should you use ARR for AI?

Insights
Read time: 6 min

Arnon Shimoni
✓ Expert opinion
tl;dr: ARR told a clean story for fifteen years. However, ARR is an internally developed KPI based on contracted amounts of recurring monthly revenue rather than actual amounts of revenue booked. As the cost structure underneath has changed, it no longer makes sense and your board deck should reflect that before your margins do.
At SaaStock’s CFO forum this week, a panelist made the case that ARR has too many definitions and companies need to be more transparent about how they calculate it. Fair point.
Ben Murray (the SaaS CFO) has cataloged 250+ public company ARR definitions, and many of them are vague enough to hide behind, but transparency doesn’t fix a metric that’s purely wrong.
ARR shouldn’t be the primary health metric for any company with variable compute costs. That includes most AI companies and an increasing number of hybrid SaaS businesses. Disclosing your ARR formula more clearly is like labeling a thermometer in both Celsius and Fahrenheit. Helpful, sure. But if the thermometer is measuring the wrong thing, better labels don’t help.
What ARR assumes
ARR was designed for a specific economic model. Predictable 80-90% gross margins. Near-zero marginal cost per user. Contracts that were annual and recurring. One seat, one price, one line item.
Under those conditions, revenue was a reliable proxy for business health. If you knew your ARR, you knew most of what mattered. Gross margin barely moved quarter to quarter. Cost to serve customer A was roughly the same as customer B. The metric worked because the cost structure was boring.
Variable costs has ruined that stability
AI broke all three assumptions at once. Every inference call costs real money, and a single Opus call or complex code completion shows up on your infrastructure bill. When a customer runs 10,000 API calls on a flat $49 subscription, ARR still looks fine while your gross margin quietly compresses.
Why ARR is unreliable
ARR is an internally developed KPI based on contracted amounts of recurring monthly revenue rather than actual amounts of revenue booked.
Take two customers, both paying $2,000 per month. Your ARR dashboard shows two identical $24K lines.
Customer A runs light workloads. Gross margin: 78%.
Customer B runs heavy model-intensive jobs daily. Gross margin: 31%.
ARR has no mechanism to distinguish between them. And that 31% margin customer might be loss-making once you allocate infrastructure overhead, but ARR registers them as equally healthy.
Additionally, they may not even be “annual” as Customer B may churn after 3 months - but the ARR reported at the snapshot time doesn’t account for that.
Stress testing with NRR
What happens to your NRR when customers replace human seats with AI agents while still using your product?
Seat counts drop, ARR contracts, but actual usage (and your costs to serve) might be going up.
The metric is moving in the opposite direction of the economics that are below it.
Better ARR disclosure helps, but doesn’t solve
Ben Murray’s ARR disclosure guide is thorough. He lays out five questions every ARR definition needs to answer: what’s included, what’s excluded, contracts vs. revenue, the annualization formula, and how variable revenue gets handled. Companies that follow his framework will produce clearer numbers.
I agree with all of it. And it’s still insufficient for AI economics.
Precision without accuracy
You can of course, do several things:
You can disclose that your ARR annualizes the trailing 90 days of usage multiplied by four.
You can specify which revenue streams are in and which are out.
You can document the formula.
With all of these the number you produce will be precise well-documented, and still tell your board almost nothing about whether your unit economics are improving or degrading.
ARR captures revenue and ignores cost and variability.
In SaaS, margins were stable enough that this didn’t matter as much - it was 10% wrong. In AI, the cost side of the P&L swings by customer, by week, by model version. So instead of 10% wrong, this is 80% wrong.. And that’s where your business lives or dies but the “ARR” can’t see it.
The Anthropic and OpenAI examples
Ed Zitron’s reporting made this concrete. Anthropic’s leaked annualized revenue figure was $14 billion. The CFO’s court affidavit showed $5 billion in cumulative lifetime revenue.
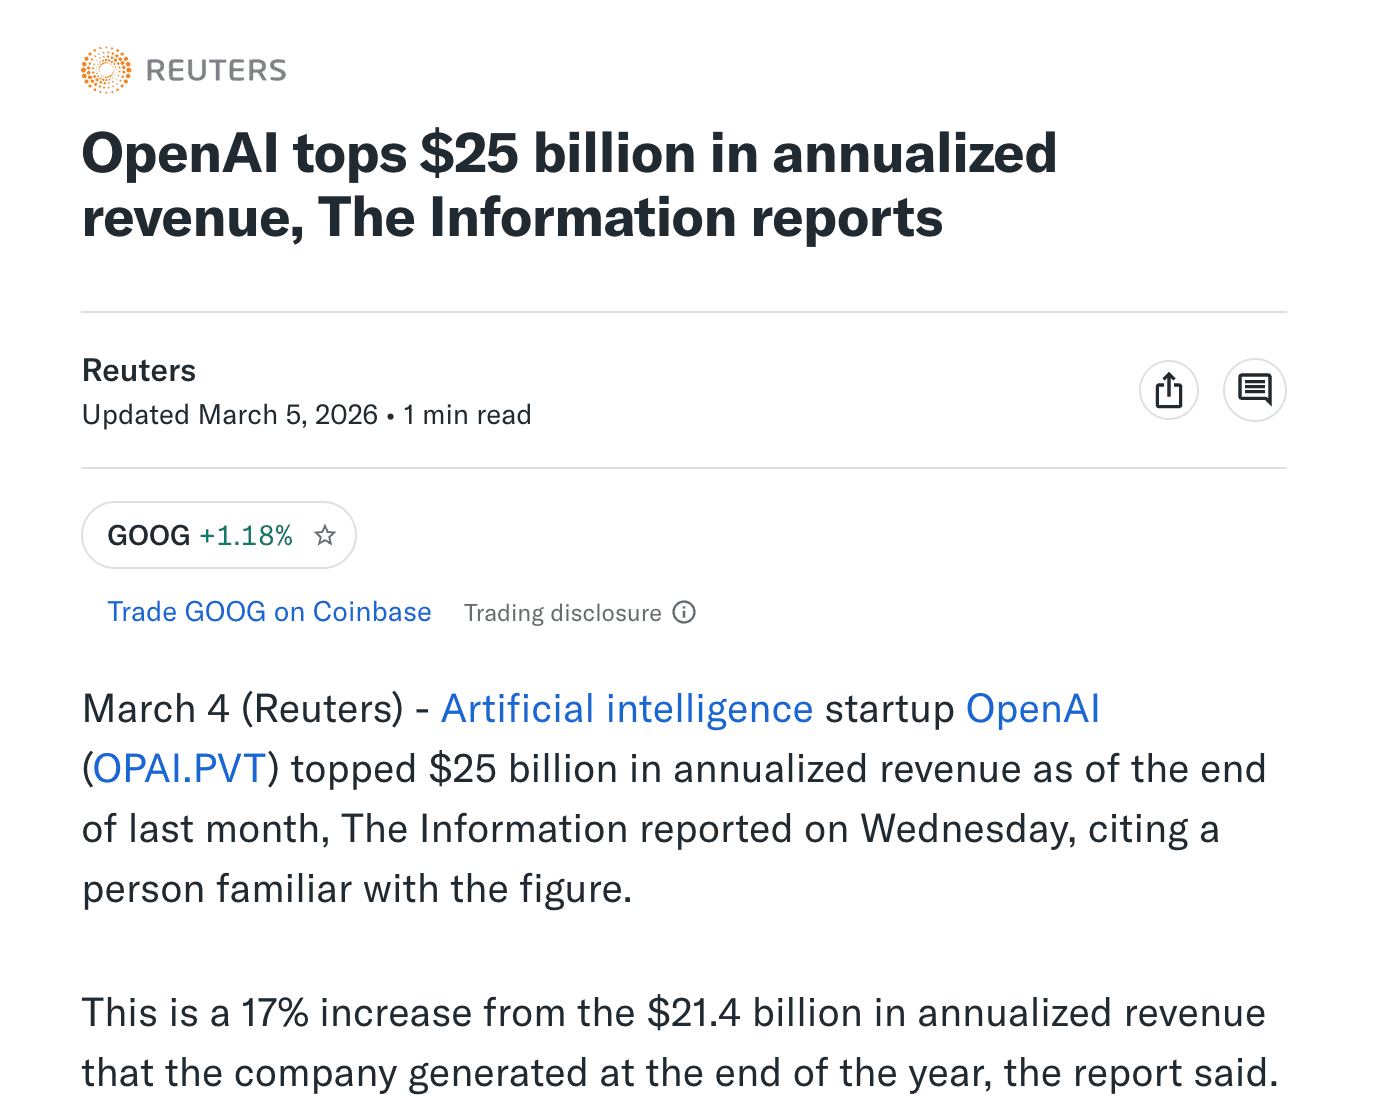
OpenAI published an ARR graphic showing “$25bn ARR”, but annualized from a single month, without disclosure - and that’s not great.
The ARR conventions reward this
These companies aren’t doing anything technically wrong by ARR conventions. Which tells you everything about the conventions. The metric allows this kind of gap between what gets reported and what the business earned. Multiply a good month by twelve, call it ARR, and the number looks stable. It may not be.
So what should we replace ARR with?
If you run an AI company or a hybrid SaaS/AI business, your board deck needs different numbers at the top.
You’re going to be going against the grain, but it may be worthwhile:
Gross profit per period → replaces ARR
Revenue growing while margin compresses looks identical in ARR. Gross profit separates the signal. If your revenue is up 40% and your gross profit is up 12%, you have a cost problem that ARR will hide until it becomes a cash problem.
Gross profit per token → replaces monthly active users
Token consumption alone is a pass-through number. The margin on those tokens tells you whether you’re building a business or subsidizing one. Kyle Poyar and CJ Gustafson made this point on Mostly Growth: most AI companies can’t answer what their gross profit per token is, per customer, in real time. The data lives across three systems that don’t talk to each other.
First year value → replaces LTV
LTV compounds assumptions about churn, expansion, and retention. AI products haven’t earned the right to project any of those. Switching friction is lower than any previous generation of software. If your model doesn’t pay back in year one, it rarely does.
Retention by output quality cohort → replaces customer health scores
SaaS health scores track login frequency, feature adoption, support tickets. AI customers evaluate you on one thing: are the outputs good? A customer who logs in daily but gets mediocre results will leave. A customer who runs one high-value workflow per week will stay for years. You’ll see the churn signal three quarters late if you’re measuring engagement instead of output quality.
Burn multiple → replaces LTV/CAC
Gustafson’s framing was direct: LTV/CAC is “fun with numbers” when nobody knows what the lifetime of an AI customer is. Burn multiple grounds you in cash reality.
Billing architecture still matters
Most companies can’t produce these numbers even if they wanted to. Their billing system records what the customer paid. Their infrastructure monitoring records what it cost to serve them. Their finance team reconciles the two in spreadsheets at month-end. By the time someone sees the picture, they’re looking at last quarter.
Three systems, no single source of truth
You need a billing layer that meters token consumption, maps it against inference costs by model and tier, and surfaces gross profit per customer as usage happens. Not at month-end close. As it happens.
The companies still reporting ARR as their primary health metric are showcasing their billing system’s limitations as much as their business performance.
Why we built Solvimon for this
At Solvimon, our infrastructure connects revenue and cost data in a single ledger because we come from building Adyen’s billing engine, where €970B+ in annual payment volume taught us that you can’t separate what a customer pays from what they cost you. The orchestration code that most companies write to bridge their billing tool, their cost data, and their finance spreadsheets? That’s the problem we eliminate.
What to Do Before Your Next Board Meeting
If you’re a CFO or CEO presenting to a board this quarter, do three things:
Keep ARR in the deck. Your board expects it, investors benchmark against it, and removing it creates more confusion than it solves. But move it from slide 2 to the appendix.
Put gross profit per period on slide 2 instead. Show the trend. If revenue and gross profit are growing at the same rate, great. If they’re diverging, your board needs to see that divergence, not an ARR number that masks it.
Add a unit economics slide that shows gross margin by customer cohort. Segment by usage intensity. Your board will ask questions you haven’t been getting, and those questions are the ones that matter.
Related
AI token pricing. What token pricing is, current provider rates, and where it breaks down.
What Snowflake, Twilio, and Cursor teach about token economics. Three pricing rollouts and what they show about charging for usage.
Solvimon for AI. Billing infrastructure built for token, credit, and hybrid pricing.
Ready for billing v2?
Solvimon is monetization infrastructure for companies that have outgrown billing v1. One system, entire lifecycle, built by the team that did this at Adyen.